With system complexity dramatically increasing and the ever-important focus on improving development timelines, detailed information on the interaction of patterns and timings of system activities is crucial.

Spyker
Traditional performance analysis tools require pre-instrumenting an application with special calls or running it under a specially instrumented kernel. SpyKer, on the other hand, enables an ordinary kernel to be auto-instrumented at run-time by dynamically patching a LynxOS-178 or LynxSecure kernel binary with logging calls.
The overhead of a SpyKer trace patch is exceedingly low, minimizing its impact on the target system. This enables truly objective measurements and eliminates any problem of timing invasiveness standing in the way of finding particularly evasive bugs.
Developers are empowered to gather, display, and interact with data concerning their application, making it easy to view normally difficult-to-understand relationships within the application. The front-end GUI displays event data in an easy-to-comprehend fashion, including allowing multiple windows with different visualization to be displayed concurrently.
The SpyKer front-end GUI is written in Java and runs on any workstation equipped with a Java Virtual Machine, hence the front-end can reside locally or remotely from the system to be measured (which can be targeted over a TCP/IP connection).

DECREASED DEVELOPMENT COSTS
Fast, automated, and transparent collection of timing information.

ACCELERATED DEVELOPMENT AND DEBUGGING
Easy, any time visibility in to program execution” with “Simple visibility into program execution.

ENHANCED PRODUCT QUALITY AND RELIABILITY
ACCURATE, ACTIONABLE PERFORMANCE, TUNING INFORMATION.
SPYKER-TZ POWERED BY TRACEALYZER TECHNOLOGY FROM PERCEPIO
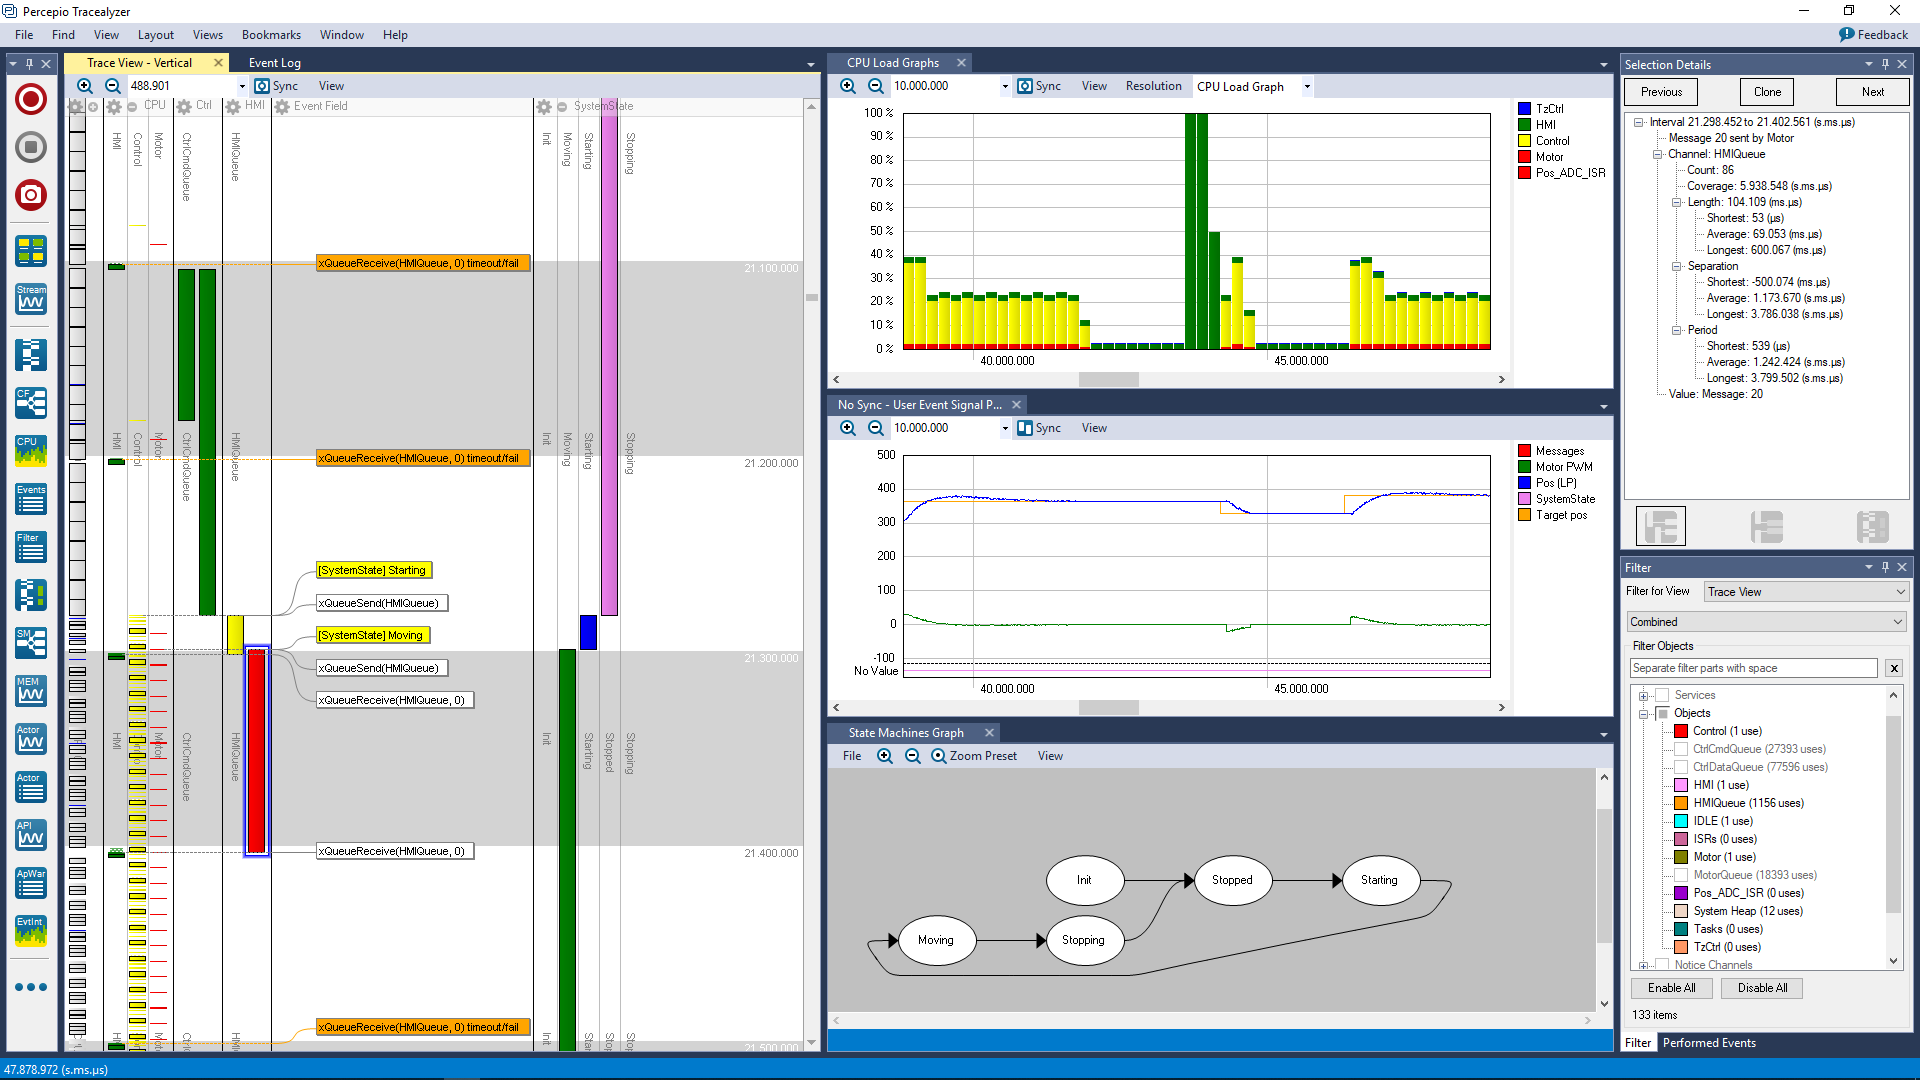
SpyKer-TZ is an enhanced version of Spyker powered by Tracealyzer technology from Percepio, a Lynx partner. Spyker-TZ is a trace analysis tool designed for multithreaded systems featuring LYNX MOSA.ic and bare metal code that support multiple use-cases across many application domains, including profiling of resource usage, timing analysis, system-level debugging and software design analysis.
The tool displays trace data in multiple views, including an advanced trace view, a CPU load graph and a textual event log. This provides the user with a top-down workflow that is ideal for system-level analysis, where anomalies, such as a spike in the CPU load, can be found visually in graphical overviews.
Additional levels of detail enable the user to drill down into the specific details in the trace view and event log to identical the root cause of the anomaly.


